|
 |


|
|
Maha Oya which originates in the hilly regions around Aranayakje ,Bible rock and Kadugannwa has catchment area 1538 Sq Km and a stream length of 130 km .Average rainfall inmost parts of this catchment area usually exceeds 3800 min oer annum Average annual runoff is about 1485 million meters.
Ma oya Originates from Kadugaana district and flows through four districts Kegalle ( 32 % of the district) Kurunegala (8% of the district) Gampha (23% of the district ) and a small portion of puttalum district (2%) covering three provinces as Central , Sabaragama and western. The water shed of Ma Oya is characterise with extensive paddy, rubber tea and coconut plantations.
Ma Oya has very little hydro power potential . The most important use of water in the Ma Oya is for the supply of drinking water , presently there are 14 water supply intake is located i the basin serving an urban population of about 200,000.

A map of Sampling Locations
| Sampling Locations: | GPS Coordinates: |
| Sampling Point 1 (Kochchikade Bridge) | ( 79 51 51 E, 7 16 14 N) |
| Sampling Point 2 (Badalgama Bridge) | ( 80 11 39 E, 7 18 07 N) |
| Sampling Point 3 (Kotadeniyawa Bridge) | ( 80 03 41 E, 7 17 07 N) |
| Sampling Point 4 (Giriulla Bridge) | ( 80 07 23 E, 7 19 45 N) |
| Sampling Point 5 (Alawwa Bridge) | ( 80 14 26 E, 7 17 34 N) |
| Sampling Point 6 (Karadana Bridge) | (80 18 55 E, 7 19 17 N) |
| Sampling Point 7 (Hiriwadunna Bridge) | ( 80 23 04 E, 7 17 17 N) |
| Sampling Point 8 (Mawanella Bridge) | ( 80 26 20 E, 7 15 10 N) |
| Sampling Location |
WQI |
Ecological Condition |
Grade |
Color code |
| Kochchikade Bridge | 53 | Poor | D | Orange |
| Badalgama Bridge | 63 | Poor | D | Orange |
| Kotadeniyawa Bridge | 68 | Fair | C | Yellow |
| Giriulla Bridge | 72 | Fair | C | Yellow |
| Alawwa Bridge | 66 | Fair | C | Yellow |
| Karadana Bridge | 68 | Fair | C | Yellow |
| Hiriwadunna Bridge | 60 | poor | D | Orange |
| Mawanella Bridge | 74 | Fair | C | Yellow |
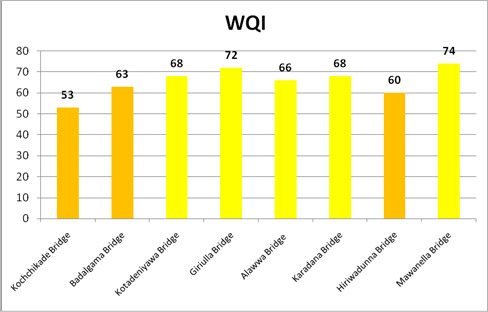
Plot of WQI against Sampling Locations of Maha Oya
The WQI scores for monitoring stations were plotted over station numbers from upstream to down stream. The highest WQI score in the Mahaoya was detected at the most upstream site, located at Mawanella Bridge (Station No:8) and the lowest score was detected at the most down stream site located at the Kochchikade Bridge.The length of the Mahaoya is nearly is nearly 130 Km, the first 30 Km stretch upstream to the Mawanella bridge is considered as upstream and last 30 Km stretch downstream to the Badalgama bridge considered as down stream and rest 70 Km stretch considered as Middle stream of the Mahaoya
The most upstream site had the best water quality compared to the other seven. Water quality index ranked first among the eight sites monitored. This site is situated quite to the source of drinking water for the Mawanella town and flows down from mountain terrain therefore, the high rate of aeration occurs. The sources of contamination upstream to this sits are few except domestic use such bathing and washing. This is reflected in the parameter contributions where exceedances rare and very small when then do occur. Interestingly, the only parameters to exceed always were turbidity and occasional exceedances of other parameters (16.7 % COD, 16.7 % Pb, 16.7%FC)
The midstream site to the Mawanella Bridge had the inferior water quality compared to the it’s upstream site. Water quality index ranked seventh among the eight sites monitored and Lower than the upstream value. This site is situated quite close to the Hiriwadunna water intake of NWS & DB flows through a relatively flattened fairly urbanized terrain therefore, rate of aeration is relatively low, This of stretch of receives substantial amount of wastewater from industrial activities such as rubber factories and vehicle service stations. The anthropogenic activities such as sand mining, bathing and discharge of domestic waste also relatively high and contribute to the inn tributes to the inferior water quality and low WQI value. Parameters to exceed were turbidity at all time and other parameters occasionally (16.7%DO, 16.7%COD, 16.7%BOD, 33.3%FC)
The midstream site nest to the Hiriwadunna Bridge had the better water quality compared to the it’s upstream site. Water quality index ranked third among the eight sites monitored and higher than the upstream value. This site is situated quite close and 100 m upstream to the water intake of NWSDB and flows through a relatively flattened rocky terrain. Therefore, the rate of aeration is fairly high.
This stretch of river receives fair amount of waste water from small scale industrial activates and runoff from agricultural activities .The anthropogenic activities such as sand mining, bathing and discharge of domestic waste are also relatively high and contributes to the inferior water quality and low WQI value.Parameters to exceed were turbidity at all time and other parameters occasionally (16.7% COD, 16.7%FC)
The midstream site next to the Karadana Bridge had the inferior water quality compared to the it’s upstream site. Water quality index ranked fifth among the eight sites monitored and higher than the upstream value. This site is situated side by the Allawwa town flows through a relatively flattened terrain therefore; rate ofaeration is relatively low. This stretch of river receives fair amount of wastewater from drainage of Alawwa town, small scale industrial activities and runoff from agricultural activates. The anthropogenic activities such as sand mining, bathing, washing and discharge of domestic waste are also relatively high and contribute to the inferior water quality and low WQI value. But it shows better water quality than upstream site may be due to the dilution effect receiving waters from tributaries,Parameters to exceed were turbidity at all time and occasional exceedances of other parameters (16.7%Cr, 50.0% FC)
The midstream site next to the Alawwa Bridge had the better water quality compared to the it’s upstream site. Water quality index ranked second the eight sites monitored and higher than the upstream value. This site is situated side by the Giriulla town and flows through a relatively flattened rocky terrain therefore, rate aeration is considerably high. This stretch of river receives fair amount of wastewater form drainage of Giriulla town, small scale industrial activities and runoff from agricultural activities. The anthropogenic activates such as bathing, washing and discharge of domestic waste are also relatively low because it flow through a relatively unbranded area but sand mining is highest in this stretch. Aeration less anthropogenic activities and dilution effect of receiving water from. Tributaries contribute to the better water quality and higher WQI value. parameters to exceed were turbidity at all time and 50% expedience of feacal Coliform bacteria, but nonn of the other parameters were exceeded during the monitoring period.
The midstream site next to the Giriulla Bridge had the inferior water quality compared to the it’s upstream site. Water quality index ranked third among the eight sites monitored and lower than the upstream value. This site is situated away from Katadeniyawa town area and flows through a relatively felatively flattened rocky terrain therefore, rate of aeration high. This stretch of river receives fair amount of water from small scale industrial activities and runoff from agricultural activities. Since this stretch flower through a relatively less urbanized area, the anthropogenic activities such as mining, bathing, Washing and discharger f domestic waste are also relatively low. Parameters to exceed were turbidity at all time and other parameters occasionally (33.3% COD, 16.7%BOD, 16.7%FC)
The midstream site next to the Kotadenivawa bridge had the inferior water quality compared to the it’s upstream site. Water quality index ranked sixth among the eight sites monitored and lower than the upstream value. this site is situated away from the Badalgama town area and flows through a relatively flattened terrain therefore, rate of aeration is low. This stretch of rive receives fair amount of water high and medium scale industrial activities and runoff from agricultural activities. Since this stretch of river flows through a relatively less urbanized area, the anthropogenic activities such as bathing, washing and discharge of domestic waste are also relatively low. The industrial activities and sand are mainly contribute to the inferior water quality and low WQI value. Parameters to exceed were turbidity at all time and other parameters occasionally (33.3% COD, 33.3% BOD, 16.7%FC).
The downstream site next to the Badalgama Bridge had the worst water quality compared to the all other sites. Water quality index ranked among the eight sites monitored and lowest. This site is situated across the Colombo-Chilow main road and flows through a relatively flattened terrain therefore, rate of aeration is low. this stretch of river receives fair amount of waste water from high and medium scale industrial activities and runoff from agricultural activities. Since this stretch of river flow through a highly urbanized area, the anthropogenic activities such as bashing, washing, sand mining and discharge of domestic wastewater and solid waste are also very high. Since this is closer to the rive mouth salinity intrusion occults regularly and highest during the February-March period. The industrial activities, other anthropogenic activities and salinity intrusion are the main contributors to the inferior water quality and lowest WQI value. parameters to exceed were turbidity at all time and the occasional exceedence
parameters (16.7%DO, 50.0% COD,33.3% CD.66.7% FC)
The spatial pattern of deteriorating trend of water quality from upstream to downstream was not surprising in the Mahaoya Main reason for this pattern is the major water pollution in the Mahaoya is due to anthropogenic activities which occurs considerably at mid and down strum portion of the rive, pollution due to non point source natural events happens throughout the river evenly therefore, it can be considered as back ground pollution. In addition, downstream portion of the rive receives fair amount of treated wastewater from the industries located at the downstream stretch of the river.


![]()
![]()
![]()
![]()


![]()
![]()


 The Central Environmental Authority organized the 16th...
Read more
The Central Environmental Authority organized the 16th...
Read more
 To mark the commencement of the New Year 2024, the...
Read more
To mark the commencement of the New Year 2024, the...
Read more
 The World Wetlands Day national program held on February...
Read more
The World Wetlands Day national program held on February...
Read more
 The Central Environmental Authority conducts many...
Read more
The Central Environmental Authority conducts many...
Read more

|
Central Environmental Authority |
|
|
104, Denzil Kobbekaduwa Mawatha, |
|
|
Tel: 011-2872419,011-2872278,011-2873447,011-2873448 |
|
© 2013 Copyright Central Environmental Authority - Sri Lanka.All rights Reserved.
Solution by: ![]()